Analytics
The Analytics page shows who is using Optima, how much, and how well it is going — across chat, the API and Scheduled Tasks. You can use it to see which models and Assistants people rely on, spot failures and slow responses, and check whether your Gateway has enough capacity.
Analytics never shows what anyone said. Optima records one line per request — who made it, which model answered, how many tokens it used, how long it took, how it ended and which tools it called — and nothing of the messages, answers, titles or tool results.
Who Can See It
You need the Analytics permission. It is not given to new User accounts automatically, so you must tick it for each person who should have it. Admin accounts always have it. See Users and Permissions.
The Page
Open Analytics from the menu.
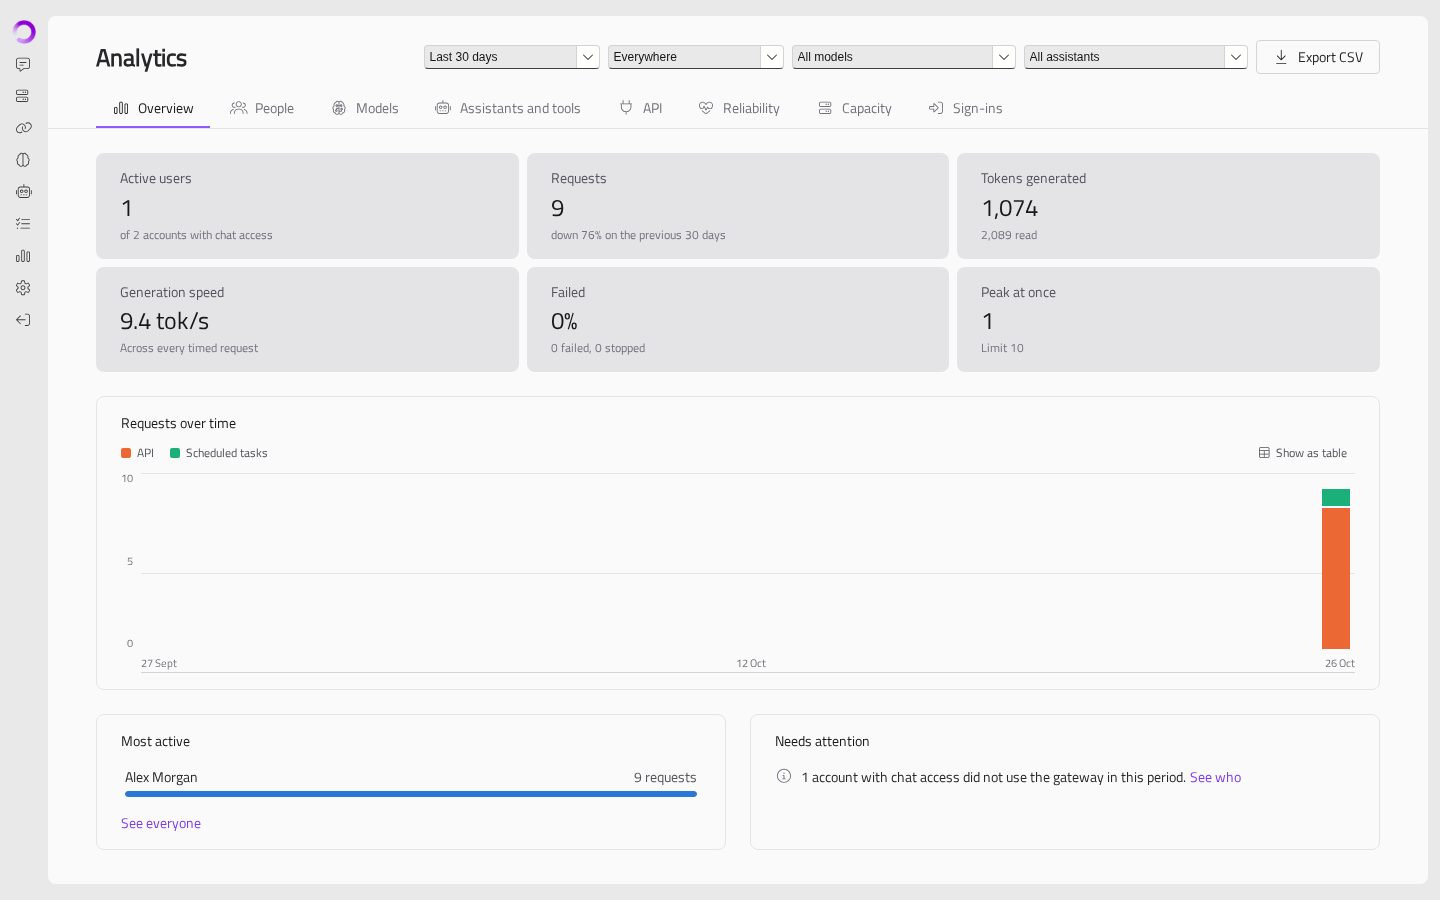
You can use the bar at the top to narrow what is shown:
| Filter | Choices |
|---|---|
| Date range | Last 7 days, Last 30 days, Last 90 days, Last 12 months |
| Source | Everywhere, Chat, API, Scheduled tasks |
| Model | All models, or one model |
| Assistant | All assistants, or one Assistant |
Click Export CSV to download the tables on the current tab.
Tabs
The page is divided into tabs, each looking at use from a different angle:
| Tab | What it shows |
|---|---|
| Overview | Active users, requests, tokens generated, generation speed, failures and the most people chatting at once, with trends |
| People | Each person's requests, tokens, days active and tool calls |
| Models | Use and performance of each model |
| Assistants and tools | Which Assistants and tools are used, and how often |
| API | API requests, which keys were used, and requests refused for rate limits or for being too large |
| Reliability | Requests that failed, were stopped or cut short; tool loops stopped early; and conversations that had to leave out earlier turns or drop tool results to fit |
| Capacity | How many people were chatting at once — typically and at peak — and how often that went over your licence's concurrent-user limit (counted only: nobody is refused). Also how busy each Node was |
| Sign-ins | Successful and failed sign-ins, and the addresses failures came from |
Tip
The Reliability and Capacity tabs are a good place to look when people say Optima is slow or unreliable.
On The Home Page
People with the Analytics permission will also see a Usage panel on the Nodes page. It shows active users and requests today, tokens generated in the last week, the most people chatting at once, and a chart of requests over the last 14 days. When something needs attention, a link will say how many things need it and take you to them. Click Open analytics for the full page.
Recording Settings
You can control what is recorded in Settings → General:
- Record usage for Analytics — turn this off to stop recording. The page will then say that recording is off.
- Keep individual requests for (months) — how long the per-request records are kept, 13 months by default. Daily totals are kept indefinitely, so long-term trends survive.
Analytics are stored in their own file on the Gateway, separate from conversations.